I've posted my data for the KE lab in this posting. This lab is contrived such that we are able to ignore the Edisp by having the dynamics track slope gently to compensate for friction slowing the cart. We then can assume that the Eel max = KE max. KE (Eel trapezoid) vs. v is plotted and so is KE (Eel triangle) vs. v. Both were top-opening parabolas. The linearized graphs and generalized mathematical models are displayed below for the cart by itself.
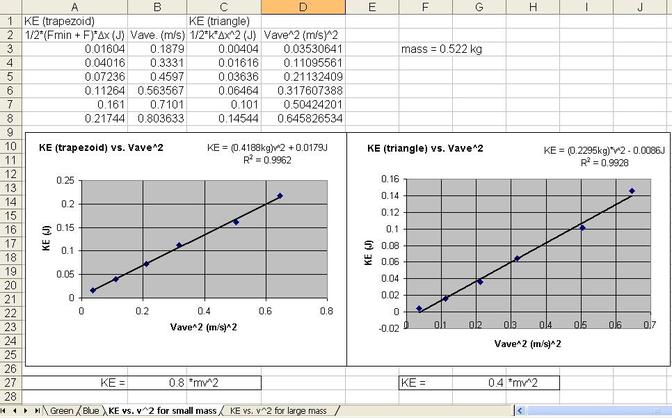
Both correlations are similar. However the general mathematical model for the case where I set Eel = 1/2*k*∆x^2 was closer to the acceptable mathematical model for KE (1/2*m*v^2).
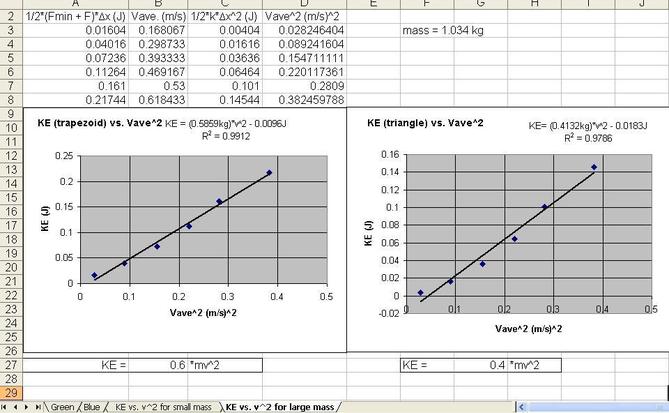
We increase the mass and repeated the experiment. In the image below you can see that the correlation for the KE (trapezoid) vs. v^2 was much better this time than the KE (triangle) vs. v^2. That said the general mathematical model was no better than the KE (triangle) vs. v^2 graph.
We increase the mass and repeated the experiment. In the image below you can see that the correlation for the KE (trapezoid) vs. v^2 was much better this time than the KE (triangle) vs. v^2. That said the general mathematical model was no better than the KE (triangle) vs. v^2 graph.
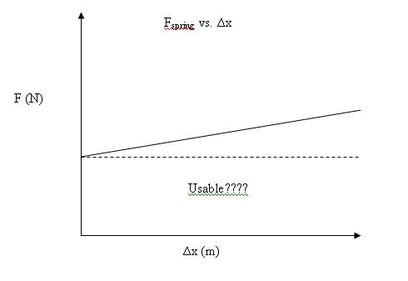
I don't think this settles the debate we had in our modeling session today of whether the rectangular area of the Eel vs. ∆x graph of a spring is usable or not but my personal opinion is that it isn't usable.

 RSS Feed
